
Page 25 - angleška varianta sist - ODDANO-FINAL 4_1_2022_FLIPBOOK-spread
P. 25
We collected responses to the survey by personally addressing individuals
whom we considered to have enough knowledge to be able to complete
the questionnaire. We e-mailed experts in the field of standardization.
In addition, we used the LinkedIn network to address persons responsible for
quality control in companies, development engineers and founders/directors
of own companies. The latter were addressed with the purpose to obtain data
from individuals who represent small and micro enterprises.
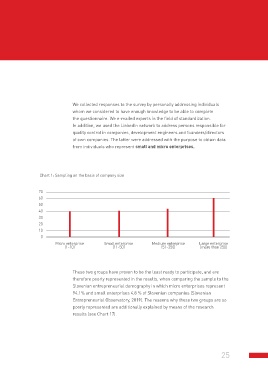
Chart 1: Sampling on the basis of company size
70 Small enterprise Medium enterprise Large enterprise
60 (11-50) (51-250) (more than 250)
50
40
30
20
10
0
Micro enterprise
(1-10)
These two groups have proven to be the least ready to participate, and are
therefore poorly represented in the results, when comparing the sample to the
Slovenian entrepreneurial demography in which micro enterprises represent
94.1% and small enterprises 4.8 % of Slovenian companies (Slovenian
Entrepreneurial Observatory, 2019). The reasons why these two groups are so
poorly represented are additionally explained by means of the research
results (see Chart 17).
25